 Log in
 Search

Hydrogen Production
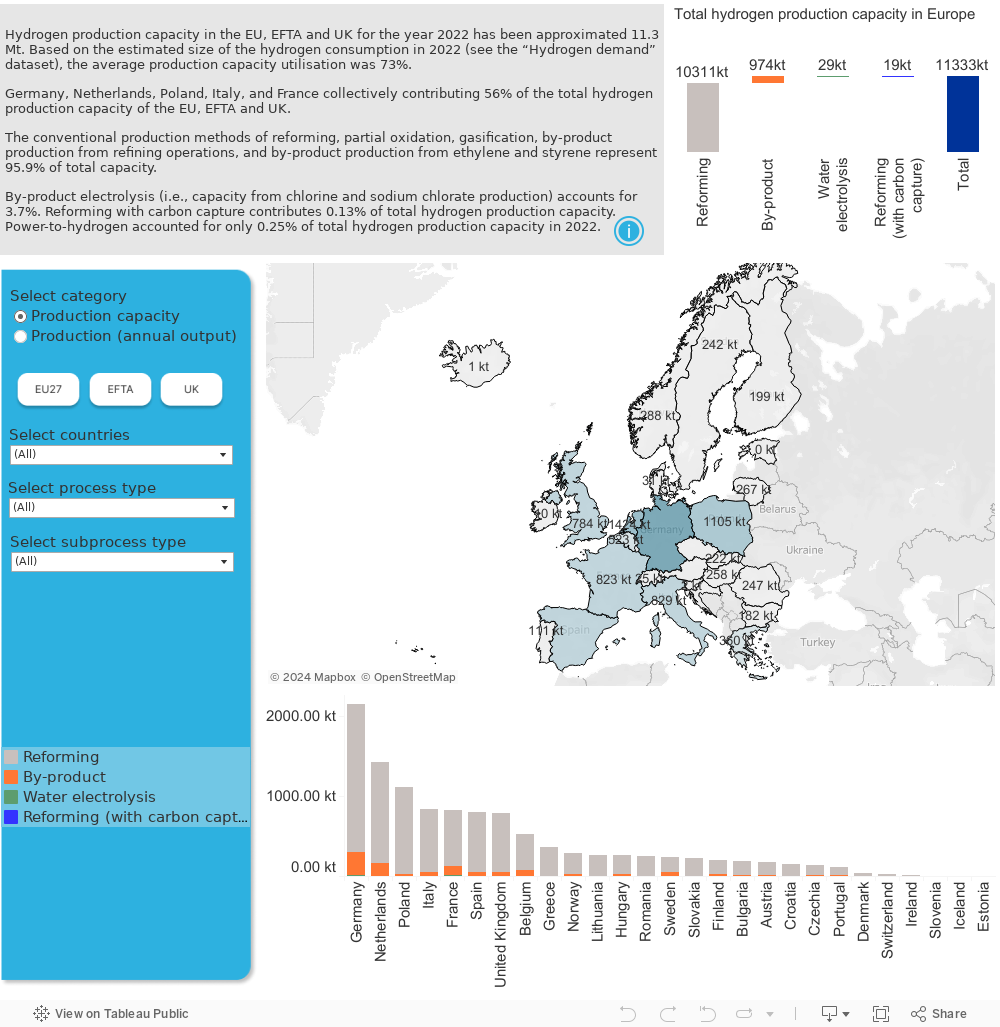
Get latest insights into hydrogen production capacity and production output by technology in Europe (EU27, United Kingdom, Iceland, Liechtenstein, Norway and Switzerland).
This datastream provides data on
- Annual conventional (fossil) hydrogen production capacity, production outputs, and number of plants per country by production process (reforming, by-product, reforming with carbon capture).
- Annual water electrolysis operational capacity (MWel), production outputs, and number of plants per country.
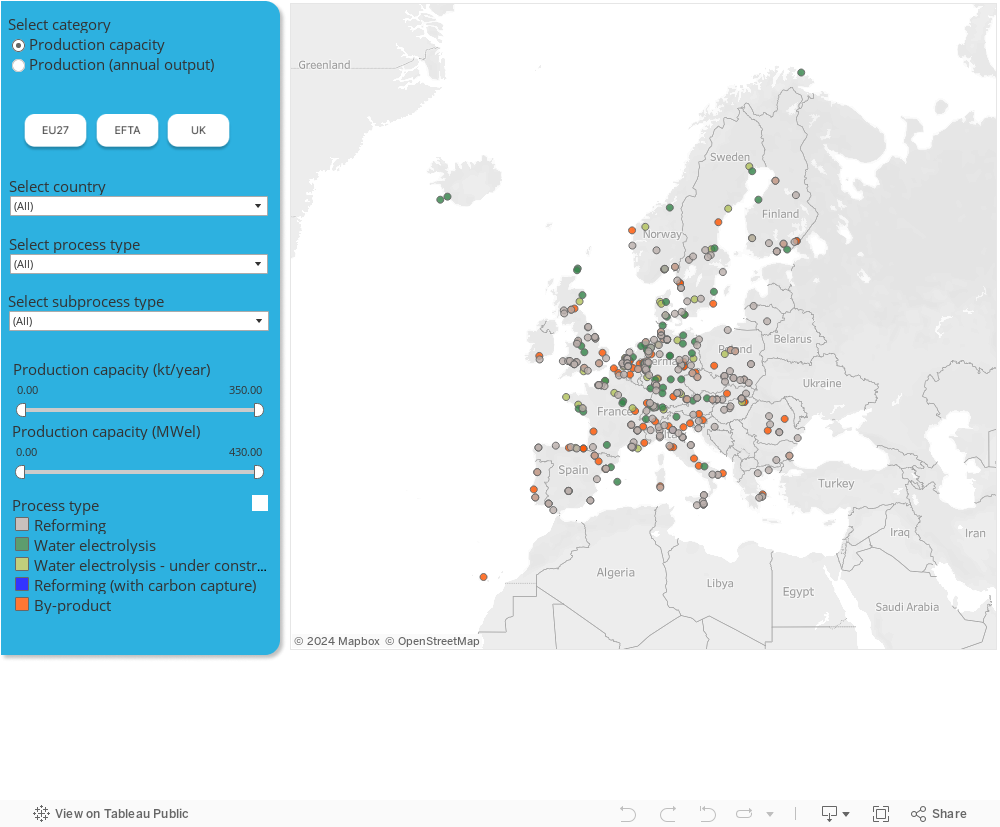
- Location, project name, production process (reforming, by-product, reforming with carbon capture, water electrolysis), sub-process (ethylene, styrene, ...), end-use, hydrogen production capacity and output on a plant-by-plant basis (see separate dashboard and note 1).
Reference years are 2024, 2023 and 2022.
Notes
- While the geolocation of all hydrogen production facilities (covering all types of production process) in Europe is available, plant by plant information on production capacity, annual production and end use for conventional (fossil) hydrogen production facilities is provided for only six countries (France, Italy, Netherlands, Norway, Poland and Spain).
- In cases where exact production capacities are confidential, manual adjustments have been made to match either the quantity disclosed in a public source or an approximate value.
- Only water electrolysis installations with a production capacity of at least 0.5 MWel are visualized on a plant-by-plant basis on the geomap.
Assumptions
- For all water electrolysis plants, the production is calculated on the basis of an efficiency of 53 kwh/kg and a utilisation rate of 68%.
- The utilization rates for ammonia production plants are estimated using data from ICIS, Eurostat’s PRODCOM database and press releases from specific sites.
- The utilization rates for refineries are estimated using KPMG’s and BP’s data from the Statistical Review of World Energy report, as well as manual adjustments done to sites where the actual utilisation rate is known.
- The utilization rates for methanol production plants are estimated using Eurostat’s PRODCOM database.
- The utilization rates for ethylene and styrene production plants are estimated using Eurostat’s PRODCOM database where possible and refineries utilisation rates for countries not covered by Eurostat.
- The utilization rates for chlor-alkali production plants are based on Eurochlor’s monthly reports on chlorine production in the EU.
- The utilization rates for sodium chlorate production plants is taken from the overall utilization rate of the entire chemical sector in Europe, provided on the CEFIC website.

