 Log in
 Search

Hydrogen Demand
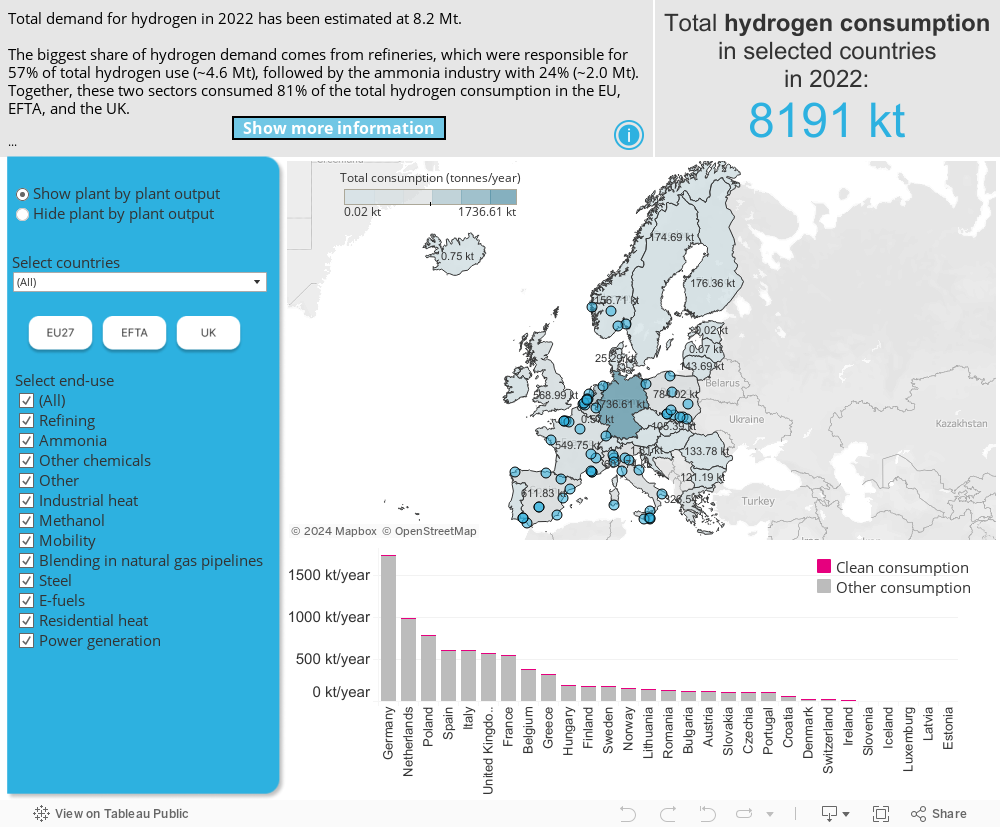
Get latest insights into annual hydrogen consumption per end-use in Europe (EU27, United Kingdom, Iceland, Liechtenstein, Norway and Switzerland).
This datastream provides aggregated data on annual consumed tonnes of hydrogen and number of (consuming) plants per country and by sector.
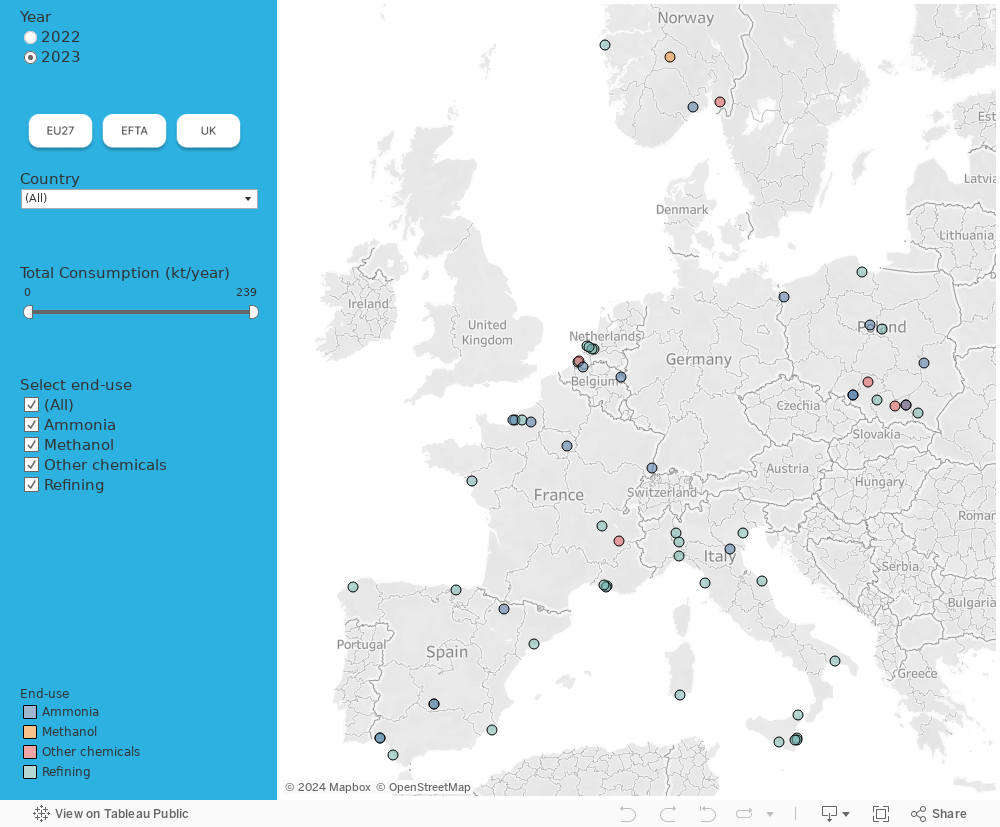
In addition, plants producing hydrogen for the production of ammonia, methanol, refining and 'other chemicals' are visualised on a plant-by-plant basis for six countries (France, Italy, Netherlands, Norway, Poland and Spain).
Reference years are 2024, 2023 and 2022.
Notes:
- Total hydrogen consumption in Europe is not equal to its production because some hydrogen is also imported, exported or vented into the atmosphere.
- For the sectors included in the plant-by-plant outputs, the sum of the consumption of each plant in a country may not correspond to the aggregate consumption for that sector in that country due to merchant hydrogen that could not be assigned to a specific consumption point but whose overall final end use is known. In other words, only consumption for captive hydrogen producers (e.g., ammonia, refineries or “other chemicals”) that have their own SMR units is reflected in the plant-by-plant outputs.
Assumptions:
- Hydrogen consumption for ammonia production equals the (sum of) production of hydrogen in all/that ammonia plant plus the production from merchant suppliers (located nearby).
- Hydrogen consumption for refining equals the (sum of) production of that/all refinery’s own hydrogen production, 40% of total hydrogen produced as a by-product from ethylene plants (only when located nearby) and all hydrogen produced as a by-product from styrene plants (located nearby).
- Hydrogen consumption for methanol production equals the (sum of) production of hydrogen in all/that methanol plant.
- Hydrogen consumption for ‘other chemicals’ equals the sum of captive production from ‘other chemicals’ plants and/or the sum of production from dedicated merchant suppliers (to those plants), plus 40% of total hydrogen produced as a by-product from ethylene plants (only when located nearby) and all hydrogen produced as a by-product from styrene plants (located nearby).
- Hydrogen consumption for industrial heating equals the sum of captive SMR production from chemical plants for the purposes of industrial heating plus 60% of hydrogen produced as a by-product from ethylene plants and 85% of hydrogen produced as a by-product from chlor-alkali and sodium chlorate plants (the remaining 15% is assumed to be vented in the atmosphere).
- Hydrogen consumption for mobility is estimated through the number of FCEV in the country and their average fuel consumption rates.
- The production or import of hydrogen for which no specific end use can be attributed is indicated as ‘Other’.
- Clean hydrogen refers to hydrogen that is produced with a carbon intensity below 3.38 kg CO2 / kg H2

