 Log in
 Search

Scenarios for future hydrogen demand
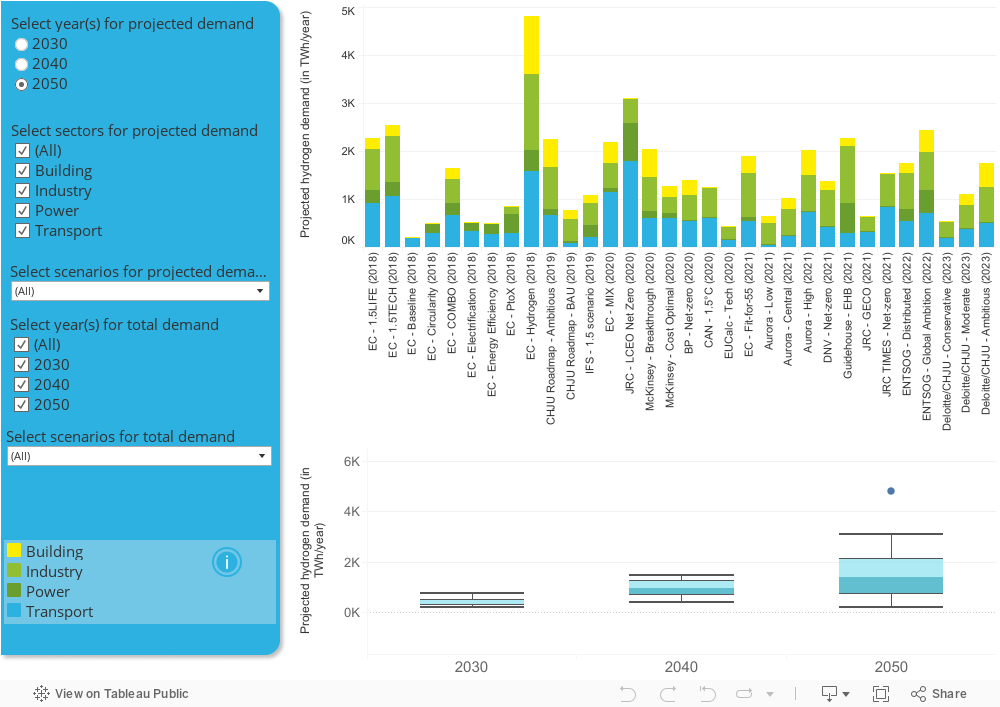
Many organisations have conducted modelling studies of the expected demand for hydrogen in Europe over the coming decades. Model outputs are derived from tailored narratives with a large number of parameters and assumptions, resulting in a broad spectrum of hydrogen demand forecasts, particularly for 2040 and 2050.
This interactive tool brings together the most recent and best-accepted hydrogen demand scenarios for 2030, 2040 and 2050 by sector (industry, transport, buildings and electricity) in Europe. It is designed to facilitate comparison between the results of scenarios, and to provide a snapshot of the distribution of the projected demand (upper bound, median, lower bound).
A document outlining the sectoral scope, narratives and associated key assumptions of all scenarios integrated into this dashboard as well as link to the original studies is available for download.
Notes:
- 33.33 Terawatt-hour (TWh) of hydrogen = 1 million tonnes (Mt) of hydrogen
- The box diagram below gives a visual indication of how the scenario outputs are distributed and compared with each other. The box’s lower hinge represents the first quartile (Q1; the 25th percentile) of the data, the line in the middle of the box represents the median (Q2; the 50th percentile) of the data and the box’s upper hinge represents the third quartile (Q3; the 75th percentile) of the data. The lower whisker shows the minimum data value. The upper whisker shows the maximum data value. The boxplot also displays outlier values in comparison to the rest of the data (they sit on the outside of whisker lines).

