 Log in
 Search

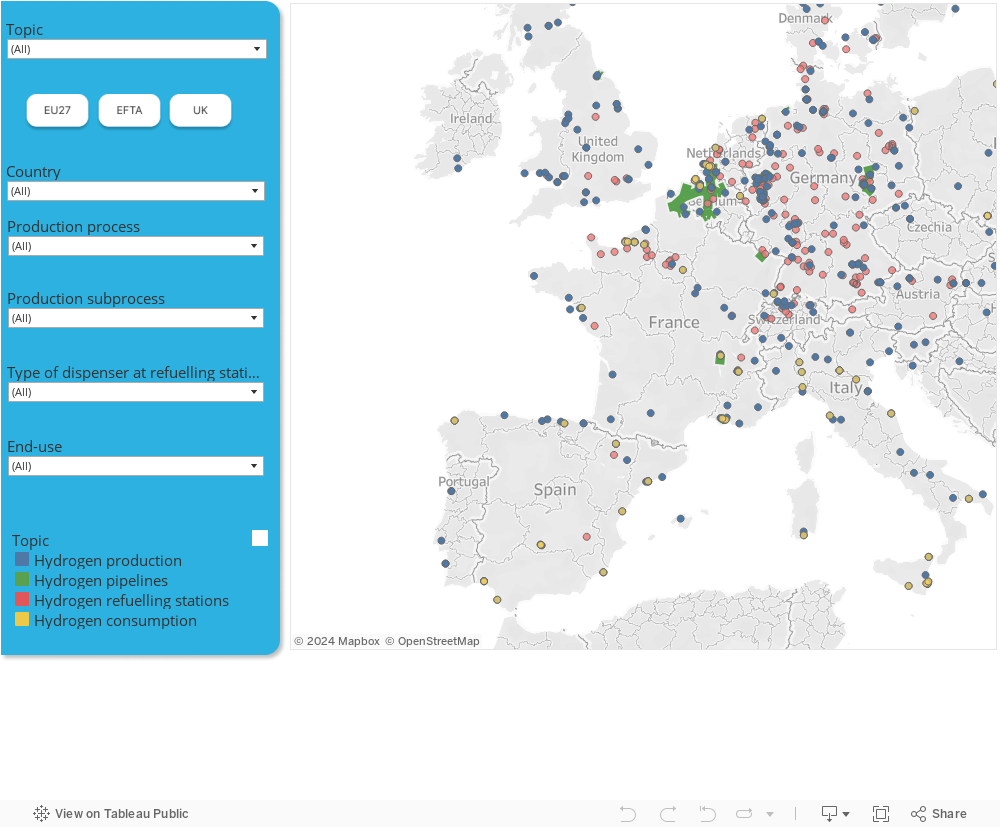
Geomap
Visually explore the European hydrogen market through our customisable and interactive geomap.
This customisable geomap brings together data on:
- Location and main attributes of hydrogen production plants (see note 1).
- Location and dispenser type of publicly accessible and operational hydrogen refuelling stations in Europe.
- Location and main attributes of operational dedicated hydrogen pipelines in Europe.
- Location and main attributes of hydrogen consuming plants (ammonia, methanol, refining and 'other chemicals') in six countries (France, Italy, Netherlands, Norway, Poland and Spain).
Notes
- While the geolocation of all hydrogen production facilities (covering all types of production process) in Europe is available, plant by plant information on production capacity, annual production and end use for conventional (fossil) hydrogen production facilities is provided for only six countries (France, Italy, Netherlands, Norway, Poland and Spain).
- Only water electrolysis installations with a production capacity of at least 0.5 MWel are visualized on the geomap.
- Only consumption for captive hydrogen producers (e.g., ammonia, refineries or “other chemicals”) that have their own SMR units is reflected in the plant-by-plant outputs.

